Empirical Rule Lesson
Empirical Rule Definition
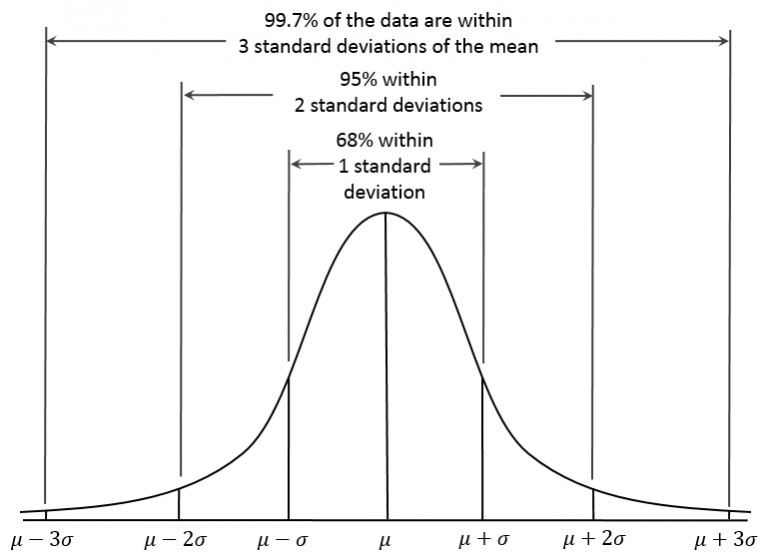
The empirical rule states that almost all the data in a normal distribution falls within three standard deviations of the mean. Specifically:
68% of data – falls within one standard deviation from the mean.
95% of data – falls within two standard deviations from the mean.
99.7% of data – falls within three standard deviations from the mean.
The empirical rule gives us a shortcut to estimating how much of our data will be in a certain range of measured vales. It is especially useful when we only have the resources to measure a sample of the population. If we know the population data follows a normal distribution, we can leverage the empirical rule.
The Other Names of the Empirical Rule
The empirical rule also goes by two other names:
- The 68-95-99.7 Rule
- The Three Sigma Rule
The 68-95-99.7 naming convention comes directly from the percentages of data that will fall within their respective standard deviations, as shown in the image above. Memorizing this version of the rule name is very useful because we can recall the percentages immediately from it.
The three sigma rule naming convention is a result of the rule telling us how many standard deviations three different percentages of data fall within. Standard deviation is notated by the Greek lowercase sigma letter "σ". Therefore, we can call it the three sigma (standard deviation) rule.
Why do we use the Empirical Rule?
There are two main situations where using the empirical rule is very useful. They are as follows.
- Testing if a distribution is normal.
If significantly less than 99.7% of the data falls within three standard deviations from the mean, it may not be a normal distribution. If it is not a normal distribution, then we may not use normal distribution shortcuts, including the empirical rule. - Forecasting what the data from the entire population may look like by using the data from a sample of the population.
This saves money and time. We do not have to measure the entire population (which could be millions or more of data points) to get basic metrics of it. We can approximate the population by using the sample mean and sample standard deviation. If the distribution of data is normal then the empirical rule will give us a good outline of the metrics for 99.7%, 95%, and 68% of the population.