Average Rate of Change Lesson
Average Rate of Change Definition
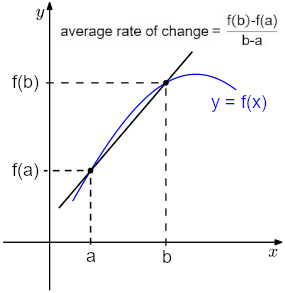
The average rate of change of a function is given as:
$$\frac{f(b)-f(a)}{b-a}$$
Where f(b) and f(a) are the values of the function f at points b and a respectively.
The formula gives us the rate of increase (or decrease) the function experiences between endpoints a and b. Average rate of change means "the average rate that the value changes" which is why it is expressed as function value change divided by function input change.
If we have a graph but do not have the function defined, we must use points on the graph. In the x-y coordinate system, the average rate of change formula is the slope formula. The slope formula is given as:
$$m=\frac{y_{2}-y_{1}}{x_{2}-x_{1}}$$
This gives us the average rate of change between the points (x1, y1) and (x2, y2). See the image below for a visual of average rate of change between two points on a function.
How to Calculate Average Rate of Change
If we know the function and interval that we are calculating average rate of change on, we use the standard formula.
Here's an example problem for calculating average rate of change of a function:
Find the average rate of change of f(x) = 3x2 + 5 on the x interval [-1, 3].
Solution:
- Let's set a = -1 and b = 3 so that a is the left side of the interval, and b is the right side of the interval.
f(a) = f(-1) = 3(-12) + 5 = 8
f(b) = f(3) = 3(32) + 5 = 32 - Now, let's plug in our values into the formula.
(32 - 8)⁄(3 - (-1)) = 24⁄4 = 6 - The average rate of change is 6.
How to Calculate Slope
If we know the x and y coordinates of the two interval endpoints, we simply use the slope formula to calculate the average rate of change. Using the slope formula saves us time versus using the average rate of change formula.
Here's an example of calculating slope from the points on a graph:
Find the average rate of change of a function between the points (3, 6) and (10, 4).
Solution:
- Let's make point 1 the left side of the interval and point 2 the right side of the interval.
x1 = 3, y1 = 6
x2 = 10, y2 = 4
(4 - 6)⁄(10 - 3) = -2⁄7 - The average rate of change of the function between given points is -2⁄7.